UI Bites
-
My favorite part of Youtube is how the video plays for about 3 seconds before the "pause video" functionality finally loads.
-
@Steve_The_Cynic said in UI Bites:
how to correct this particular cretinism, or a reliable method that doesn't involve major reconfiguration?
Uhm, Linux is open source, so Linux guys will just tell you that that's absofuckinglutely easy: download the source code, change the behavior there, rebuild everything, and install it.
Really, that's nothing, isn't it? And every Linux moron can do so!


-
-
@BernieTheBernie Someone who tries to tell me that will get told to See Figure 1.
For reference, here is Figure 1.
			---------------------------
			!            -            !
			!           { }           !
			!           | |           !
			!           | |           !
			!        .-.! !.-.        !
			!      .-!  ! !  !.-.     !
			!      ! !       !  ;     !
			!      \           ;      !
			!       \         ;       !
			!        !       :        !
			!        !       |        !
			!        |       |        !
			!                         !
			---------------------------
				  Figure 1.
-
@anonymous234 said in UI Bites:
My favorite part of Youtube is how the
videoad plays for about 3 seconds before the "pause video" functionality finally loads.At least that's what Le Goog would like...
-
@Applied-Mediocrity Adblock Plus: "YouTube has ads?"
Filed under: Blakeyrant: Ad blocking is theft
-
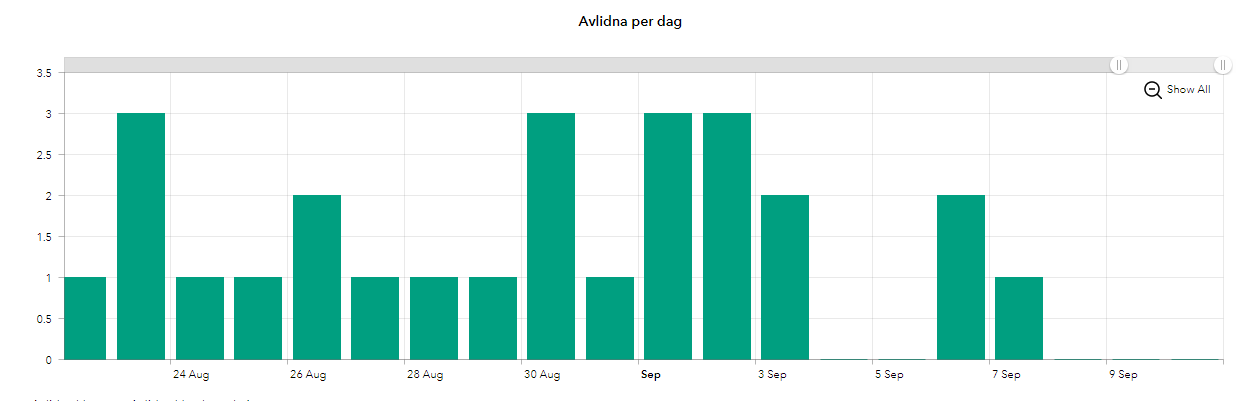
A tiny UI wtf from FHM of Sweden and their covid death graph showing halves for death graphs. Alas, there are no half deaths, that'd make it a proper wtf.
-
@HardwareGeek said in UI Bites:
@Applied-Mediocrity Adblock Plus: "YouTube has ads?"
Filed under: Blakeyrant: Ad blocking is theft
You wouldn’t watch a car.
-
@Carnage Maybe that's supposed to mean: "Almost dead by the end of the day"?
-
Or "turned into a zombie".
-
@Carnage Maybe that's supposed to mean: "Almost dead by the end of the day"?
-
@dkf Can't not have a Princess Bride reference:

-
-
@Carnage Maybe that's supposed to mean: "Almost dead by the end of the day"?
More likely "we're too lazy to set the graph scale display options to remove fractions"(1). Not sure that's any better.
(1) All the actual numbers of deaths shown are integers.
-
@HardwareGeek said in UI Bites:
@dkf Can't not have a Princess Bride reference:
Yeah, means it's not quite time yet to go through the pockets for small change
-
@Steve_The_Cynic People almost always seem to lazy to set graph tick mark intervals to something sensible. I must have written the code to auto-scale graphs sensibly at least 3 times by now. But Microsoft can't even be bothered to do it right in Excel.
-
@bobjanova it's easy to write purpose-specific autoscaling. It's much harder to make something that works at the very least quite well on every single one of the billions of graphs that are made in Excel everyday.
-
@ixvedeusi said in UI Bites:
@HardwareGeek said in UI Bites:
@dkf Can't not have a Princess Bride reference:Yeah, means it's not quite time yet to go through the pockets for small change
Curious Covid Conundrum of the Day... I used to always carry change, sometimes in awkward quantities, wherever I went outdoors. Since the beginning of France's lockdown thing in mid-March, I haven't bothered, even when I go out to shop. The supermarket supplies coin-sized plastic tokens if you need one to unlock the shopping cart/trolley things(1), and I don't need change for anything else.
(1) A common everyday term I hear for them is "caddie", although the "proper" word is "chariot". "Caddie" is, in fact, a genericised trademark, like kleenex or thermos or hoover(2).
(2) British genericised trademark for "vacuum cleaner" and by extension a verb for "to use a vacuum cleaner".
-
@bobjanova it's easy to write purpose-specific autoscaling. It's much harder to make something that works at the very least quite well on every single one of the billions of graphs that are made in Excel everyday.
"Use 1, 2 or 5 within the power of 10 that gives you a sensible number of tick marks" is the algorithm I use when I don't want to think too hard, and that works fine (not perfect sometimes, but fine) for any numeric range. Although to be fair maybe Excel is less crap than it used to be because it has actually ranged my axes like that on the last graph I made.
I remember seeing a lot of graphs with tick marks like '0, 24, 48 ...' and stupid stuff like that.
-
@Steve_The_Cynic said in UI Bites:
The supermarket supplies coin-sized plastic tokens if you need one to unlock the shopping cart/trolley things(1), and I don't need change for anything else.
Here they've inserted tokens in all carts and taped the opening shut back in March. They're still using the carts to limit the number of customers in the shop at the same time as well.
-
@bobjanova said in UI Bites:
Although to be fair maybe Excel is less crap than it used to be because it has actually ranged my axes like that on the last graph I made.
And to top it off, for a few versions now, you've been able to override its choices with something that makes more sense to you.
"a few versions" ??? Well, the first time I used that feature was the version of Excel that I used on Windows 2.1. Er. In 1989. That sort of "for a few versions now"...
-
@Steve_The_Cynic said in UI Bites:
for a few versions now, you've been able to override its choices with something that makes more sense to you
I shouldn't have to manually override settings for each graph, it should pick something sensible for the 95% use case itself.
-
@bobjanova said in UI Bites:
@Steve_The_Cynic said in UI Bites:
for a few versions now, you've been able to override its choices with something that makes more sense to you
I shouldn't have to manually override settings for each graph, it should pick something sensible for the 95% use case itself.
OK, so what's sensible for a scale from 0 to 3? I would suggest that ((0, 0.5, 1, 1.5, 2, 2.5, 3)) is, in the general case, more appropriate than ((0, 1, 2, 3)), unless we extend the analysis to include "well, all the data points are integers, so ..." and it ends up not including fractional currency points (i.e. (($0.00, $0.50, $1.00, $1.50, $2.00, $2.50, $3.00)) or something)), and then we extend it again to also say, "well, this stuff is currency-formatted, so we allow it to ..." and then we discover that it formats JPY as fractions, or BHD (Bahraini dinar) as only two places instead of the three it requires, or ..., so we extend it again ...... And round and round it goes.
At some point, you have to stop analysing and pick something, and it's probably better to stop early.
Of course, one could (and probably should) also use the formatting for the data points (which might solve the currency thing), except that these figures for deaths probably are (in Excel terms) formatted "General" rather than "#0", and therefore we fall back on guessing.
-
@Steve_The_Cynic Or the data is hours and the half-way point between 1 and 2 is 1:30, not 1.5. OK, that specific example is just an issue of how to present the labels, but then if you have space for a lot of ticks between 1 and 2, using 1.1, 1.2, 1.3 etc. is not a good idea for time (it would translate to 1:06, 1:12 etc. whereas it's more likely you want 1:10, 1:20 etc.).
Now you're going to say "hang on, we were talking about generic numbers where we don't know what quantity they are, if they are tagged as being hours then Excel should know about it and present it better." To which I'll reply with this graph I just generated this morning:
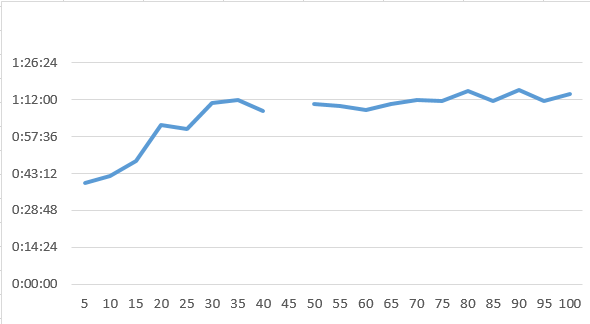
Also, does anyone know how to get a delta time plot correctly when it crosses the 24 h boundary? The data for the chart is a delta between times (with no date, because it's just debug stuff I grabbed from somewhere, not proper timestamps or whatever) so the missing data for point 45 is supposed to be "0:55:12 - 23:48:22" (i.e. a bit more than 1 hour but it crossed the midnight line).
Putting that equation gives an error (negative result), OK. Adding 24 to the operation does work nicely, I get the correct duration (1:06:50) but then the graph gets totally messed up, with everything flat except one huge spike for that point, and the vertical axis ticks being all 0:00:00. After a whole 5 seconds spent thinking about it, I just gave up and removed the point (this being just a quick debug graph to see how a process runs), but that's annoying.
-
Also, does anyone know how to get a delta time plot correctly when it crosses the 24 h boundary? The data for the chart is a delta between times (with no date, because it's just debug stuff I grabbed from somewhere, not proper timestamps or whatever) so the missing data for point 45 is supposed to be "0:55:12 - 23:48:22" (i.e. a bit more than 1 hour but it crossed the midnight line).
Convert to seconds and use modulo?
-
@Zerosquare Is there a standard function to convert to seconds? I know the equation isn't complicated but it's still more work than just doing A-B... (also I would want to convert back to hour-minute-seconds afterwards to keep my graph easy to read)
-
@Steve_The_Cynic said in UI Bites:
OK, so what's sensible for a scale from 0 to 3? I would suggest that ((0, 0.5, 1, 1.5, 2, 2.5, 3)) is, in the general case, more appropriate than ((0, 1, 2, 3)
Either of those would be fine. If you have some specific requirements then you can adjust it manually. But it shouldn't pick [0, 0.6, 1.2, 1.8, 2.4, 3.0] or something dumb like that, which I've definitely seen from chart controls in default settings.
-
Or the data is hours and the half-way point between 1 and 2 is 1:30, not 1.5. OK, that specific example is just an issue of how to present the labels, but then if you have space for a lot of ticks between 1 and 2, using 1.1, 1.2, 1.3 etc. is not a good idea for time (it would translate to 1:06, 1:12 etc. whereas it's more likely you want 1:10, 1:20 etc.).
Time formatting is a little bit complicated but there are still sensible defaults you can use for the tick size within hours and minutes (5, 10, 15, 20 or 30). Dates are where it gets a bit tricky - do you want months? they're not the same length ... nor are years. But again there is a reasonable answer when you're in the appropriate data range, and a graph package should default to that.
-
@Zerosquare Is there a standard function to convert to seconds?
=TIMEVALUE(string)(and=TEXT(value, "hh:mm:ss")for converting back), if Google is to be believed.
-
@Zerosquare said in UI Bites:
@Zerosquare Is there a standard function to convert to seconds?
=TIMEVALUE(string)Hmmm, seems to work only if the string is, well, a string. So if
A1 = 00:55:12, thenTIMEVALUE(A1) = #VALUE!. I have to putA1 = '00:55:12to force it to be seen as a string so thatTIMEVALUE(A1)returns a number. And that number is0.038333which is, uh, OK, reading the description it's a fraction between 0 (for 0:00:00) and 1 (23:59:59).So not very convenient at all. Though I can get the same conversion by using
TEXT()directly, with a format of e.g."0.000000"(btw the doc ofTEXT()is catastrophically poor, it tells you to use the "Format code you want to apply" but only gives you some examples of it and lets you guess even the most basic bits of it, i.e. that0means a digit...).Yes, in Excel logic, taking a number (a time), then converting it to text with a function named
TEXT()actually converts it to a number (that you can then use in an equation as a number), not to a string (actually, it's probably a string but in a format simple enough that Excel can auto-convert it to a number when needed, but still).(and
=TEXT(value, "hh:mm:ss")for converting back), if Google is to be believed.Which, this time, returns... a string! I.e. something that I cannot plot on my graph.
Excel, the gift that keeps on giving.
So I'm now at
=TEXT(TEXT(A2,"0.000000")-TEXT(A1,"0.000000")+1,"hh:mm:ss")and it still does not show as a time that I can plot in the same way as=A2-A1.
-
Also, does anyone know how to get a delta time plot correctly when it crosses the 24 h boundary? The data for the chart is a delta between times (with no date, because it's just debug stuff I grabbed from somewhere, not proper timestamps or whatever) so the missing data for point 45 is supposed to be "0:55:12 - 23:48:22" (i.e. a bit more than 1 hour but it crossed the midnight line).
Sounds like you need a floating modulo operation of this type:
Delta = fmod( (endtime - begintime)+24hours, 24hours )24hoursin Excel is, I believe,1.0because time values in Excel are a Julian date since Excel's somewhat wonky epoch plus a fraction of a day for the time.
-
@Steve_The_Cynic
24hoursisn't recognised.But! Combined with the previous knowledge of the weird conversions that happen, I've just found out that actually what I needed to add was not
24(for 24 hours, how naïve I was...) but rather just...1. Since that's the numerical equivalent of 24 hours in Excel internals, that correctly shifts the result.So the solution to my quest is just
=A2-A1+1.
-
@Steve_The_Cynic
24hoursisn't recognised.But! Combined with the previous knowledge of the weird conversions that happen, I've just found out that actually what I needed to add was not
24(for 24 hours, how naïve I was...) but rather just...1. Since that's the numerical equivalent of 24 hours in Excel internals, that correctly shifts the result.So the solution to my quest is just
=A2-A1+1.I suppose it depends on whether you want the textual representation or the numerical value.
-
Btw the previous one is actually another
/: the fact that A2-A1+1works shows that Excel knows perfectly well thatA2-A1is a time that is < 0 (so that it can add 1 to it and get the correct result). And yet,A2-A1produces an error, rather than, say, a negative time span.(edit: the worst thing is that it's not just an intermediate internal state! If I do
A2-A1in one cell I get an error in that cell (######) but if I then dothat_other_cell + 1, it correctly gives the time)
-
Btw the previous one is actually another
/: the fact that A2-A1+1works shows that Excel knows perfectly well thatA2-A1is a time that is < 0 (so that it can add 1 to it and get the correct result). And yet,A2-A1produces an error, rather than, say, a negative time span.(edit: the worst thing is that it's not just an intermediate internal state! If I do
A2-A1in one cell I get an error in that cell (######) but if I then dothat_other_cell + 1, it correctly gives the time)Except that what Excel knows is that
A2-A1is a date-and-time, not a time. Specifically, it's a time (in your case) that's either on the first day of the epoch if it's in [0 .. 1) or on the day before the first day of the epoch, if it's in (-1 .. 0). Formating date-and-times before the beginning of the epoch is evidently an error.
-
@Steve_The_Cynic
24hoursisn't recognised.Also, don't be an smartarse. I said that
24hoursis1.0.
-
@Steve_The_Cynic said in UI Bites:
@Steve_The_Cynic
24hoursisn't recognised.Also, don't be an smartarse. I said that
24hoursis1.0.I... sorry?

I truly thought you said that this was a special variable. As in, why would you have formatted it as a quote, and without the space, if what you meant was "24 hours is
1.0"?I mean, if you took this for snark, well then, it was not intended as such when I wrote it, but now I would definitely intend it as such, because writing it that way was at least confusing, if not plain dumb.
-
@bobjanova said in UI Bites:
@Steve_The_Cynic said in UI Bites:
OK, so what's sensible for a scale from 0 to 3? I would suggest that ((0, 0.5, 1, 1.5, 2, 2.5, 3)) is, in the general case, more appropriate than ((0, 1, 2, 3)
Either of those would be fine. If you have some specific requirements then you can adjust it manually. But it shouldn't pick [0, 0.6, 1.2, 1.8, 2.4, 3.0] or something dumb like that, which I've definitely seen from chart controls in default settings.
And that takes us right back to @Carnage's post above.
-
@Steve_The_Cynic said in UI Bites:
@Steve_The_Cynic
24hoursisn't recognised.Also, don't be an smartarse. I said that
24hoursis1.0.I... sorry?
I truly thought you said that this was a special variable. As in, why would you have formatted it as a quote, and without the space, if what you meant was "24 hours is
1.0"?I mean, if you took this for snark, well then, it was not intended as such when I wrote it, but now I would definitely intend it as such, because writing it that way was at least confusing, if not plain dumb.
Hmm. OK. Yes, it would have been clearer if I had worded it as "The metavariable
24hoursis, in Excel, just1.0." Sorry. (The key point is that the formula is general. In UNIX time,24hourswould be 86400.0 (seconds per day), while if 1.0 represents an hour, then24hoursis 24.0.)
-
@Steve_The_Cynic Not to nitpick, but to me any phrasing where you're referring to
24hourswith this syntax and formatting implies that this very specific sequence of characters has a special meaning to Excel, rather than just the abstract concept of 24 hours (either as a time or span).Anyway. I've learnt something about time and Excel, and I've had fun mocking Excel weirdness, so a good discussion all in all

-
When I select the A4 preset, “Transparent background” carries from the previous document.
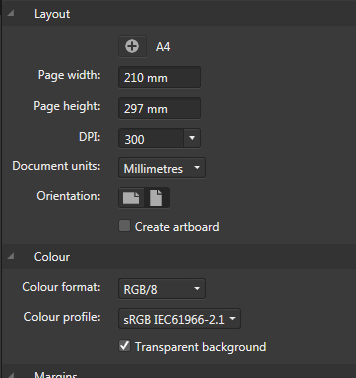
Deselect that, and it now shows as a custom preset:

That “Custom” on a normal A4 document irks me, so switch to something else and reselect the A4 preset…
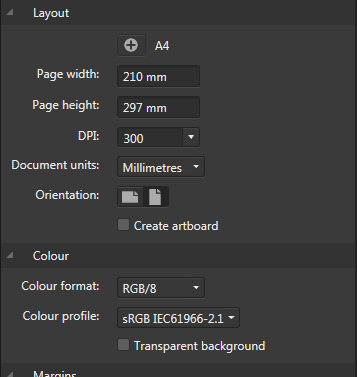
So the transparency of the background isn’t part of the preset at all, but shows as a modification anyway.
-
Not to nitpick, but to me any phrasing where you're referring to 24hours with this syntax and formatting implies that this very specific sequence of characters has a special meaning to Excel, rather than just the abstract concept of 24 hours (either as a time or span).
I've also never seen an identifier start with a digit in any language.
-
@error It's Excel we're talking about. Even PHP seems sane in comparison (see e.g. above the
pile that is TEXT).
-
I've also never seen an identifier start with a digit in any language.
I think it's legal to do it in a few, but it is pretty rare. Lisp is the most notable example, where there are
1+and1-functions (that do unitary increment and decrement) commonly defined. Every other language that allows it still doesn't actually make anything useful with it by default because actually using it confuses more users than it helps.
-
confuses more users than it helps
That can be said of many things; confusing users is not exactly difficult.
-
@HardwareGeek said in UI Bites:
confuses more users than it helps
That can be said of many things; confusing users is not exactly difficult.
Confusing users is the underlying point of software, isn't it? I mean, I've always been trying to do my best confusing the user. Was I doing anything wrong
 ?
?
-
Confusing users is the underlying point of software, isn't it?
You want to confuse them such that two goals are achieved:
- They don't ask for support.
- They keep on paying you.
-
-
@boomzilla Lacs.
-
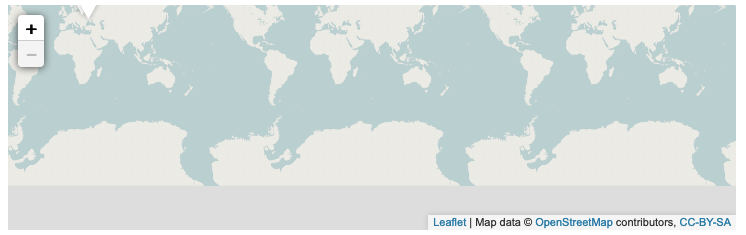
Scrolling with the trackpad, inadvertently zoomed out a bit too much on this map: