In which @error solicits recommendations and feedback
-
Hopefully this thread will be the place where I go to ask for help choosing libraries and practices and feedback.
Who am I kidding, it will go

 off the rails within the first 10 posts.
My first questions is about diagrams. I want to document a state machine with a diagram and include it alongside my source code. I would like for the diagram to not be a binary blob, but something that I can diff/merge against, and be somewhat legible without installing any software. So a free embeddable web-renderer, and somewhat human-readable source-code (XML would qualify, or something Markdown-like). Free (as in beer) is another requirement.
This is for a state graph, but if it can support other kinds of diagrams that's gravy.
So far I've found this: http://yuml.me/
Which seems like the right idea but feels kind of amateur hour in execution/presentation. Is there something better?
Bonus
 : UML - good or evil?
-
@error try www.draw.io
saves out as HTML with a dash of CSS.
-
@error said in In which @error solicits recommendations and feedback:
My first questions is about diagrams. I want to document a state machine with a diagram and include it alongside my source code. I would like for the diagram to not be a binary blob, but something somewhat human-readable that I can diff/merge against, and be somewhat legible without installing any software.
You can use Graphviz for that
-
@accalia said in In which @error solicits recommendations and feedback:
@error try www.draw.io
saves out as HTML with a dash of CSS.
Looks cool. Why am I paying for Visio (and by I, I mean, "my employer")?
And I can export to XML, so that's perfe--
<mxfile userAgent="Mozilla/5.0 (Windows NT 6.1; Win64; x64) AppleWebKit/537.36 (KHTML, like Gecko) Chrome/53.0.2767.4 Safari/537.36" version="5.5.2.0" editor="www.draw.io" type="device"><diagram>hVTBcsIgEP2a3BNQ2x5ba+2lM53x0DOFNTAlIUOI0X69xCwh0bR6kX2wb/e9XU3oujhuLavkhxGgE5KKY0JfE0JI+rDwXx1y6pEsWz71SG6VQCwCO/ULCKaINkpAPXnojNFOVVOQm7IE7iYYs9a002d7o6dVK5aHihHYcaZv0S8lnOzRR7KK+DuoXIbK2Qr1fTP+k1vTlFgvIXR/+fTXBQtcKLSWTJh2BNGNN9Ya45m7U3Fcg+7MDbb1eW9/3A59Wyixt/8T/FWXcGC6QenYlzsFL1qpHOwqxru49QNP6It0hfZR5o9IANYBzn+miQuEHWzBFODsyT8JC7NAN3BdyBLjNnqfBcfkyPcVYgzHnQ/UUbI/oOp5B+h9B6AUz91S+YhrVteKz1kA4man7howEhg0j/UFzIJmTh2m9HOiscKnUb7w4C8NPOgvDT+zQFGbxnLArPG2XBEt0qtBXQ/AMZuDuyG6zGCQPTcWH8al75/Hvxa6OQM=</diagram></mxfile>
-
@error said in In which @error solicits recommendations and feedback:
hVTBcsIgEP2a3BNQ2x5ba+2lM53x0DOFNTAlIUOI0X69xCwh0bR6kX2wb/e9XU3oujhuLavkhxGgE5KKY0JfE0JI+rDwXx1y6pEsWz71SG6VQCwCO/ULCKaINkpAPXnojNFOVVOQm7IE7iYYs9a002d7o6dVK5aHihHYcaZv0S8lnOzRR7KK+DuoXIbK2Qr1fTP+k1vTlFgvIXR/+fTXBQtcKLSWTJh2BNGNN9Ya45m7U3Fcg+7MDbb1eW9/3A59Wyixt/8T/FWXcGC6QenYlzsFL1qpHOwqxru49QNP6It0hfZR5o9IANYBzn+miQuEHWzBFODsyT8JC7NAN3BdyBLjNnqfBcfkyPcVYgzHnQ/UUbI/oOp5B+h9B6AUz91S+YhrVteKz1kA4man7howEhg0j/UFzIJmTh2m9HOiscKnUb7w4C8NPOgvDT+zQFGbxnLArPG2XBEt0qtBXQ/AMZuDuyG6zGCQPTcWH8al75/Hvxa6OQM=
..... wait..... what?!
..... okay. that's technically XML, but not helpful.
use HTML. that's universal.
-
@accalia said in In which @error solicits recommendations and feedback:
..... wait..... what?!
..... okay. that's technically XML, but not helpful.
It looks marginally better once I turned off the (on-by-default) "compression" option. If I run it through a beautifier before commit, I think I can make it work.
@accalia said in In which @error solicits recommendations and feedback:
use HTML. that's universal.
Yes, but I want the diagram to be "open source" and editable by anyone (particularly, me, as I roam from workstation to workstation). I suppose it does offer cloud storage options, but "in the repo" makes sense to me for source files.
-
@error said in In which @error solicits recommendations and feedback:
It looks marginally better once I turned off the (on-by-default) "compression" option.
oh. yeah. that does look better. much better.
-
graphviz.
-
@error said in In which @error solicits recommendations and feedback:
@accalia said in In which @error solicits recommendations and feedback:
use HTML. that's universal.
Yes, but I want the diagram to be "open source" and editable by anyone (particularly, me, as I roam from workstation to workstation). I suppose it does offer cloud storage options, but "in the repo" makes sense to me for source files.
 Write an svg. Open it in inkscape or something if you want to edit it. Bonus: CSS styling works so you can have mouseovers etc. Fits inside html but is also a 'real image format'. What the hell could be more open-sourceable?
-
@fbmac said in In which @error solicits recommendations and feedback:
You can use Graphviz for that
@tufty said in In which @error solicits recommendations and feedback:
graphviz.
I'm trying to check it out but either their site has cooties or my work PC does (or, more likely, the corporate proxy).
-
@error doing diagrams with graphviz isn't very practical
-
-
@AyGeePlus SVG might be a viable option, but I like having tools that are aware of the semantics of the diagram, or a language which is aware of the semantics.
@accalia's suggestion has nice authoring tools and passable semantics. It fits my needs.
-
This actually looks intriguing. I wish their gorram website would load.
-
@error If only programmers didn't idolize 1976 so much, you might be able to simply store your source files in RTF or some other format that allows embedded images.
-
@error said in In which @error solicits recommendations and feedback:
Yes, but I want the diagram to be "open source" and editable by anyone
HTML isn't?
-
@Yamikuronue Not if it's some bastardized use of HTML, which seems like it would be required to draw a DAG. Semantic HTML is a heirarchical document. Diagrams and graphs often aren't. So I assumed some hackery would be involved to fit that square peg into the round hole.
If you can prove me wrong, then I'd love to see a counter-example.
-
@error said in In which @error solicits recommendations and feedback:
If you can prove me wrong
you didn't look at the markup spit out by draw.io on export to HTML, did you?
-
@accalia specifically it actually rendered on any browser. yes editing requires draw.io to do well, but you needed that anyway, this way at least anyone anywhere can view without installing an app, or needing to load it in an external website.
-
@accalia said in In which @error solicits recommendations and feedback:
@error said in In which @error solicits recommendations and feedback:
If you can prove me wrong
you didn't look at the markup spit out by draw.io on export to HTML, did you?
<!--[if IE]><meta http-equiv="X-UA-Compatible" content="IE=5,IE=9" ><![endif]--> <!DOCTYPE html> <html> <head> <title>Untitled Diagram</title> </head> <body style="background-color:#ffffff;"> <div class="mxgraph" style="position:relative;overflow:auto;width:100%;"> <div style="width:1px;height:1px;overflow:hidden;">3ZbPd5swDMf/Gu4B1qS7psu6w3bKYWcHK+DVIKaYAvnra7Ac45fltLf+WC6xv5Yl6yMpL0n+UA+PJNrqB0rQSbaSQ5J/SbIsW20+2a9JGZ2SpnefnVKSkqwFYa/OwOKK1U5JOEWGBlEb1cZigU0DhYk0QYR9bHZEHUdtRekjBmFfCH2t/lTSVE69z9ZB/waqrHzkdM35HUTxVBJ2DcdLsvw4f9xxLbwvTvRUCYl9JA0rz4J9jl7IWGhFEz3zjFhHAsHpgpS9HhW/lfcHJAnkC+Y0rZqnJbh8Z4tMiPbmtKqHB9BToX0J3bWvN04vDAmaKPatCxt34Vnojt/OjMzo6wLSlom3SKbCEhuhd0Hdzuxh8mipbStTa7tM7fIXGDNyp4nOoJWCh++ILdu5mFOgm2mwdMKOCrbipxpBJbDV3Cuc6SNgDYbGuTZaGPUcexeMvbzYBU52waj+jI1DL7AdEa/I2UZrpyUM9nlbid1hPpkyDsimXV8pA/tWzJn1dr5jjBwMyACP+y1A16n7C37K/a9Dzvs+jFrqe7JajNmatb+hxSP0IZuMf32WTXb/Sk2Wso//hZtrwVcAx7EX3A6C3vN05m85nT52hOv8nnHdvSWuefojWr+74SM1V7b5d7TsNvx3mc8W/1bz3Qs=</div> </div> <script type="text/javascript" src="https://www.draw.io/js/embed-static.min.js"></script> </body> </html>
-
@error Ew, not human-editable. Shame.
Yeah, you probably want something that outputs an SVG
-
Well, 18 posts in and yet not derailed...
I use http://plantuml.com. Nice text format and it can be integrated in your favourite environment (including Word :P). The Confluence plugin is a bonus for my workplace.
-
@presidentsdaughter said in In which @error solicits recommendations and feedback:
Well, 18 posts in and yet not derailed...
I use http://plantuml.com. Nice text format and it can be integrated in your favourite environment (including Word :P). The Confluence plugin is a bonus for my workplace.
Looks promising.
Your username just reminded me that I never got closure about the president's daughter.
Filed under: #neverforget
-
@error said in In which @error solicits recommendations and feedback:
@accalia said in In which @error solicits recommendations and feedback:
@error try www.draw.io
saves out as HTML with a dash of CSS.
Looks cool. Why am I paying for Visio (and by I, I mean, "my employer")?
And I can export to XML, so that's perfe--
<mxfile userAgent="Mozilla/5.0 (Windows NT 6.1; Win64; x64) AppleWebKit/537.36 (KHTML, like Gecko) Chrome/53.0.2767.4 Safari/537.36" version="5.5.2.0" editor="www.draw.io" type="device"><diagram>hVTBcsIgEP2a3BNQ2x5ba+2lM53x0DOFNTAlIUOI0X69xCwh0bR6kX2wb/e9XU3oujhuLavkhxGgE5KKY0JfE0JI+rDwXx1y6pEsWz71SG6VQCwCO/ULCKaINkpAPXnojNFOVVOQm7IE7iYYs9a002d7o6dVK5aHihHYcaZv0S8lnOzRR7KK+DuoXIbK2Qr1fTP+k1vTlFgvIXR/+fTXBQtcKLSWTJh2BNGNN9Ya45m7U3Fcg+7MDbb1eW9/3A59Wyixt/8T/FWXcGC6QenYlzsFL1qpHOwqxru49QNP6It0hfZR5o9IANYBzn+miQuEHWzBFODsyT8JC7NAN3BdyBLjNnqfBcfkyPcVYgzHnQ/UUbI/oOp5B+h9B6AUz91S+YhrVteKz1kA4man7howEhg0j/UFzIJmTh2m9HOiscKnUb7w4C8NPOgvDT+zQFGbxnLArPG2XBEt0qtBXQ/AMZuDuyG6zGCQPTcWH8al75/Hvxa6OQM=</diagram></mxfile>Seems to be a pattern to abuse XML this way.
-
@Maciejasjmj said in In which @error solicits recommendations and feedback:
Seems to be a pattern to abuse XML this way.
Seems like someone asked for XML, and some disgruntled developer/team implemented it that way.
We should call it FYML, or Fuck You Markup Language
-
-
@presidentsdaughter said in In which @error solicits recommendations and feedback:
Well, 18 posts in and yet not derailed...
https://what.thedailywtf.com/topic/11456/about-the-coding-help-category
-
This seems like a really powerful and expressive language. And the documentation is fucking impenetrable.
-
@error said in In which @error solicits recommendations and feedback:
I'm trying to check it out but either their site has cooties or my work PC does (or, more likely, the corporate proxy).
Their site seems to often be like that... I use it with doxygen to generate class hierarchies.
-
digraph {
  start -> a;
  g -> b [label="pause"];
  b -> g [label="unpause"];
  a -> c [label="sleep"];
  c -> a [label="wake"];
  a [label="listening"];
  b [label="paused"];
  c [label="sleeping"];
  g [label=""];
  subgraph {
    rank = same; start; g;
  }
  subgraph {
    rank = same; a; b; c;
  }
}
I can work with this.
-
It looks like I can use http://www.gravizo.com/ to embed my graphs into my Markdown docs, maybe with some kind of commit hook.
-
What's wrong with ASCII art embedded in the code comments?
[input] -> DoThing() -> [Output]
*****
* . . *
*  - *
*****
-
@error When do I get a LATEΧ plugin?
-
@JazzyJosh said in In which @error solicits recommendations and feedback:
LATEΧ
I'm allergic to latex.
Filed under: Not really.
-
-
@JazzyJosh
I'm allergic to that one too
-
@error said in In which @error solicits recommendations and feedback:
I'm allergic to latex.
Use an eraser then...
-
By coincidence, I received an rtf document, and when opening it, it showed one line of text, and two empty pages. The document was 3.5MB in size. Turns out it contained an image in some obscure format, which only Word <some arbitrary year> and LibreOffice could read. So no, rtf is not it. A state machine can be very well documented with a .dot file, and you can sure that it'll still be readable in 2076.
Here's how you use it: https://martin-thoma.com/how-to-draw-a-finite-state-machine/
-
@Hanzo Ok well the one specific file format I offhandedly suggested is apparently unsuitable according to you, so fuck progress. If that specific idea doesn't work, I guess we should totally give up on every improving anything ever.
Thank you for posting that, you have opened my eyes.
-
@error said in In which @error solicits recommendations and feedback:
Very love-hate right from the get-go. But, conceptually, pretty close to what I want.
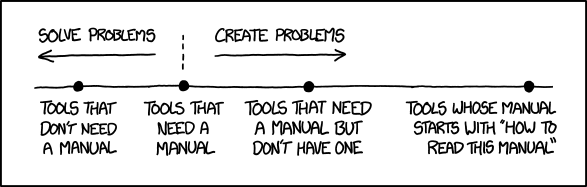
He said "manual"? Must be a fucking Linux user.
filed under: moron
-
@error said in In which @error solicits recommendations and feedback:
@fbmac First Google image search for Graphviz:

:do_not_want:

@error said in In which @error solicits recommendations and feedback:
This actually looks intriguing. I wish their gorram website would load.
because
DOT language is actually pretty simple (so simple you do not need a library for it, but there are many), then you can if you want visualize it in Graphviz.
-
Plantuml:
Open-source tool that uses simple textual descriptions to draw beautiful UML diagrams.
Easily create beautiful UML Diagrams from simple textual description. There are also numerous kind of available diagrams. It's also possible to export images in PNG, LaTeX, EPS, SVG.
(Warning: That is the most godawful website I've ever needed to visit, but you can download a PDF manual and avoid visiting there).
You generate to a png file of your choice (that you can tell your VCS to ignore). Supports most of what I've needed of UML (in a UML wanking course no less).
Example of state diagram:
@startuml
title Pacman Ghosts
[*] --> Hunting : Game Starts
Hunting : entry/setColor(blue)
Hunting : do/locatePacman()
Hunting : do/move(myStrategy)

Hunting --> Eating : Found Pacman / playSound(lostLife)
Eating --> Hunting
Eating : do/cycleColours(rainbow)

Hunting --> Running : Pacman eats Candy / playSound(powerUp)
Running : entry/setColour(red)
Running : do/locatePacman()
Running : do/move(myEscapeStrategy)

Running --> Hunting : timeout / cycleColours(rainbow)

Running --> Eaten : Pacman finds ghost / playSound(scoreUp)

Eating --> [*] : no more lives

Eaten --> Respawn

Respawn : entry/setPosition(pen)
Respawn : do/cycleColours(rainbow)
Respawn --> Hunting : timeout(2sec)
@enduml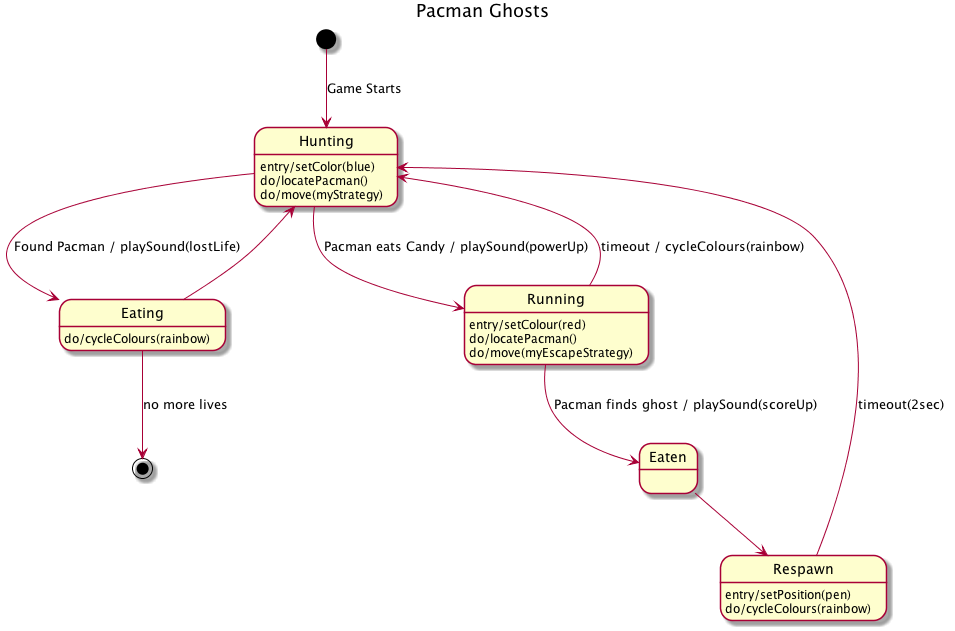
-
PlantUML doesn't do flowcharts, IIRC. I was using graphviz for that for a while.
-
@blakeyrat said in In which @error solicits recommendations and feedback:
@Hanzo Ok well the one specific file format I offhandedly suggested is apparently unsuitable according to you, so fuck progress.
You're equating using rtf over dot with progress, just because the file format is newer? Or is any suggestion you make, no matter how off-handed and useless, the very definition of progress? Enlighten me.
-
@blakeyrat RTF is an encapsulation format, not, as was requested, a diagram format. An image file encapsulated in an RTF file fails what was requested totally - you can't effectively version control any binary blob (which @error knows, as he explicitly said "I would like for the diagram to not be a binary blob, but something that I can diff/merge against").
So yeah, fuck progress, as far as progress means "something totally unfit for purpose".
SVG is better, in as far as it's (largely) binary blob free, and so can be textually diffed and so on, but it is a graphics format, and so (typically) editing something trivial in an SVG will result in massive changes across the entire file. Diffing SVGs, especially ones that haven't been produced by some specific programmatic transform of your source code, is insanity inducing.
What's needed for this is something that is semantic. Something that expresses only (or close to that) the information structure of the graph, without extraneous bits and pieces.
DOT visualised in graphviz covers that. It diffs in a largely semantic manner. You can read it in textual form, and pisses over pretty much everything else for this purpose.
-
@dse said in In which @error solicits recommendations and feedback:
DOT language is actually pretty simple (so simple you do not need a library for it, but there are many), then you can if you want visualize it in Graphviz.
I figured that out eventually. It's very
y that the documentation for the language is more difficult to understand than the language itself (which turned out to be extremely simple, once I gave up on the docs and started looking for examples).
-
@Mikael_Svahnberg said in In which @error solicits recommendations and feedback:
Plantuml:
Easily create beautiful UML Diagrams from simple textual description. There are also numerous kind of available diagrams. It's also possible to export images in PNG, LaTeX, EPS, SVG.
(Warning: That is the most godawful website I've ever needed to visit, but you can download a PDF manual and avoid visiting there).
You generate to a png file of your choice (that you can tell your VCS to ignore). Supports most of what I've needed of UML (in a UML wanking course no less).
Example of state diagram:
@startuml
title Pacman Ghosts
[*] --> Hunting : Game Starts
Hunting : entry/setColor(blue)
Hunting : do/locatePacman()
Hunting : do/move(myStrategy)

Hunting --> Eating : Found Pacman / playSound(lostLife)
Eating --> Hunting
Eating : do/cycleColours(rainbow)

Hunting --> Running : Pacman eats Candy / playSound(powerUp)
Running : entry/setColour(red)
Running : do/locatePacman()
Running : do/move(myEscapeStrategy)

Running --> Hunting : timeout / cycleColours(rainbow)

Running --> Eaten : Pacman finds ghost / playSound(scoreUp)

Eating --> [*] : no more lives

Eaten --> Respawn

Respawn : entry/setPosition(pen)
Respawn : do/cycleColours(rainbow)
Respawn --> Hunting : timeout(2sec)
@enduml
I like this.
Edit: I kind of wish the lines didn't have to dodge waaay around the text like that, but I don't care much about cosmetics, just the information. It would be neat though if the text ran parallel to the lines instead of perpendicular.
-
@Hanzo
Wait, are you the ? Or just d his namesake?
-
@tufty said in In which @error solicits recommendations and feedback:
An image file encapsulated in an RTF file fails what was requested totally
Wouldn't be the first time a suggestion was made that ignored the problem domain....
-
yEd saves files in real XML (not binary blobs). But they are more like an .svg than a .dot, as there is a lot of formating and positioning data in those files. It isn't something you would want to edit with notepad.
 DOT (graph description language) - Wikipedia
 DOT Language

