Git-style branch graphs
-
Hey, quick question: I want to communicate some proposed changes to our branching strategy. Is there a good resource for making arbitrary graphs like the ones ubiquitous for explaining git commit/branching history, so I can show what would happen in theory?
-
Build an example repo with what could happen in theory, then use Git GUI, Eclipse's history tool, or your preferred history tool.
Also, Visio.
-
Build an example repo
I was hoping for something simpler, I suck at git XD
Also, Visio.
I started down this path. It's not fun either.
-
I was hoping for something simpler, I suck at git
This would give you a chance to learn without destroying anything important. </nothelping>
-
When I need to make directed graphs, I generally turn to graphviz.
Which site seems to be down just now.

Output isn't exactly what you'd see with git, but it's easy to work with.
-
Graphviz can make very nice flowcharts, but becomes hard to work with if you're trying to have fine control over node positioning.
It wants to put all nodes in the order their arrows are pointing. If you have a cycle, or that order doesn't work for some other reason, it's easy to override on individual connections ('show these two nodes in the same rank', 'do not include this arrow in rank determinations'). But if little tweaks along those lines are not giving you a nice and useful graph, you'll need a different tool.
-
This post is deleted!
-
Graphviz can make very nice flowcharts, but becomes hard to work with if you're trying to have fine control over node positioning.
Yes, but I suspect it will be sufficient for a conceptual graph to talk about workflows. Using groups (or whatever they're called) would come in handy for that, too.
-
Oooh! Installing, will check it out.
Hopefully it's more stable than Dia.
-
Dia
Very different, I think. Works with text files, so definitely programmer friendly. You define the relationships and it figures out where to put stuff.
-
True. I've mainly used it to visualize data flow - now that I'm thinking of it, I believe there's a script floating around somewhere that uses graphviz to turn our business rules internal dependencies into graphs. For obvious reasons, these rules cannot have circular dependencies.
-
Just gather everyone around a white board and scrawl to your hearts content until everyone is looking at you with blank and confused expressions.
Lucid chart is also a great free tool.
-
I am alternating between graphviz (If I am able to auto-generate the nodes), and yEd for my graphing needs. None of them will easily support what you want to do, but yEd would be your best option since you can control node placement better and (I find) it is easier to use yEd's swimlanes than graphviz' concept of subgraphs.
-
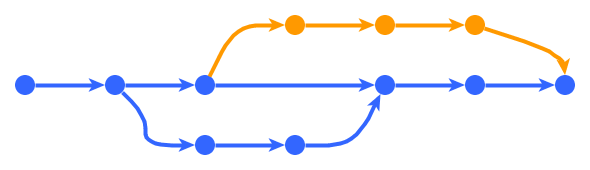
Proof of Concept using yEd:
-
turn our business rules internal dependencies into graphs. For obvious reasons, these rules cannot have circular dependencies.
In my experience, whether or not this is true depends entirely on the churn rate in the sales team.
-
About graphviz, you can force the placement of node(s) by providing their coordinates, IIRC.
At least some of the engines of graphviz did allow such manual override, but I do not use that feature a lot.
One way to see it is to ask for a dot output, from the dot input. The attribute is "pos" and to render it, use "neato -n " instead of "dot" (but you must position all nodes)
-
At least some of the engines of graphviz did allow such manual override, but I do not use that feature a lot.
Omnigraffle does this. Doing it manually is just a PiTA!
-
nothelping
WTF does no the I ping mean?
Yes I read it that way. Yes I had to double-take. I really need more sleep.
-
Yes, but I suspect it will be sufficient for a conceptual graph to talk about workflows.
FWIW, we use graphviz in one of our products to lay out the core of the main GUI. The code for integrating the graphviz engine with our Java front end so as to produce a clickable direct-interactable system is just one awful WTF on top of another, but users seem to mostly like it. (NB: the WTF is not graphviz itself, but the hacks we're using for display and interaction. We can't do simple stuff like getting SVG or PNG out and feeding it into a normal renderer because of the direct-interaction requirement; going via either of those routes loses too much information.)
-
Oh look, a maze of twisty little passages, all alike. You are likely to be eaten by a grue.
-
using yEd:
I happened to have yEd already on my machine, so I grabbed it.
Stupid annoying things... how do I add arbitrary text labels? Why is multi-select shift-click when it ought to be ctrl-click?
-
I happened to have yEd already on my machine, so I grabbed it.
Stupid annoying things... how do I add arbitrary text labels? Why is multi-select shift-click when it ought to be ctrl-click?
I am not a friend of the UI either. I think you can change some of the idiocies in the settings, though.
Arbitrary labels: I think you need to put them in a node, and make the node without border or background colour. Am AFK so I can't check right now...
 Graphviz