Scientific Linear Regression
-
Bernie is actually scientist, only bad fate brought him into software business. He still enjoys reading scientific literature, mainly "high-impact" journals like Nature and Science.
In previous week's edition of Science, he found an article titled "Computational and neurobiological foundations of leadership decisions". It contains some of the greatest statistics Bernie has ever seen. Just take a look at the upper half of figure 2:
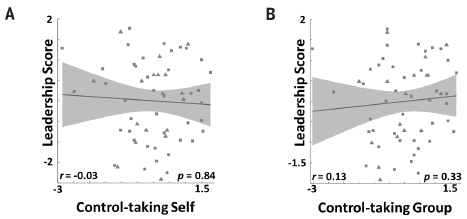
That's a very interesting way of establishing a linear regression, isn't it? Also a line perpendicular to their regression line will do.And there's much more bull shit to be found in their article, Bernie may comment on that later on.
-

-
@BernieTheBernie Those guys don't really have much of a clue what that
rvalue is for, right?
-
This reminds me of most of the education "studies" I've seen (at least the ones that actually publish their data and not just the conclusions).
From which I conclusively conclude that people who go into education research are morons.
-
@Benjamin-Hall Those who can't teach...
-
@PleegWat said in Scientific Linear Regression:
@Benjamin-Hall Those who can't teach...
Become professors of Education? Sad, but true.
-
@BernieTheBernie Maybe I'm not understanding what you mean by "establishing", but nothing here jumps out at me as indicating bad statistical practices, just some people deciding that null results deserve a figure for some reason.
If you just meant that they're implying there is a linear relationship, then yeah that's ridiculous.
-
@BernieTheBernie What is the grey area around the regression line supposed to represent?
-
@topspin it's the shadow, duh
-
@topspin Probably the 95% confidence interval around the predicted values.
-
@BernieTheBernie said in Scientific Linear Regression:
Bernie
Might just refer to Bernie's self in the third person...
-
@HannibalRex Welcome back!
-
@HannibalRex said in Scientific Linear Regression:
@topspin Probably the 95% confidence interval around the predicted values.
Wouldn't that mean that 95% of the data points would have to be inside that area? Because I'm not seeing that.
-
@Rhywden said in Scientific Linear Regression:
@HannibalRex said in Scientific Linear Regression:
@topspin Probably the 95% confidence interval around the predicted values.
Wouldn't that mean that 95% of the data points would have to be inside that area? Because I'm not seeing that.
Not in this case. Because the "predicted values" are the parameters of the linear equation. So the shaded area would represent 95% of the lines. Not that it matters because this data has no significant relationship. Anyone can see that just by looking at it.
Honestly, that's one of the first (and most important) tests you should do when you want to do linear regression. No matter what P-value or F-statistic or whatever you pull out of your ass, if it doesn't mean anything significant then statistical significance doesn't matter.
-
@boomzilla said in Scientific Linear Regression:
@Rhywden said in Scientific Linear Regression:
@HannibalRex said in Scientific Linear Regression:
@topspin Probably the 95% confidence interval around the predicted values.
Wouldn't that mean that 95% of the data points would have to be inside that area? Because I'm not seeing that.
Not in this case. Because the "predicted values" are the parameters of the linear equation. So the shaded area would represent 95% of the lines.
It's really late so I might be completely wrong, but still...
Shouldn't the confidence interval depend on the actual data? If I just give you a linear equation, you can't tell me any confidence intervals around it without knowing the data it's supposed to fit. So, like @Rhywden said, I don't see how these could be the confidence intervals for this data set, which is totally outside of the interval.
Also, shouldn't such intervals for a linear regression be straight lines, too? Why are these hyperbolic?
Maybe the confidence is better where the density (in x) is higher, even though the regression is bollocks anyway?Maybe reading the actual article would help.

-
@boomzilla said in Scientific Linear Regression:
Not in this case. Because the "predicted values" are the parameters of the linear equation. So the shaded area would represent 95% of the lines.
I think it's really the 95% confidence interval on the marginal mean of the Y value (i.e., what's the average Y going to be, given we know X is this particular value). It's probably fine to think of it as 95% of the regression lines though, because the regression line passes through your estimate of the marginal mean.
Sorry for all the
 -ry, but I think that's what people do around here?
Confidence intervals are really weird things. Technically they mean "If I repeated this experiment an infinite about of times, and constructed this interval each time, then X% of the intervals constructed would contain the true population parameter value".Then you just assume your experiment is "typical", and that the interval in front of you contains the true population parameter, somewhere in there. What people actually do is go "There's a 95% chance the population parameter is in between {lower bound} and {upper bound}". Which is wrong. But oh well.
-
@HannibalRex said in Scientific Linear Regression:
@boomzilla said in Scientific Linear Regression:
Not in this case. Because the "predicted values" are the parameters of the linear equation. So the shaded area would represent 95% of the lines.
I think it's really the 95% confidence interval on the marginal mean of the Y value (i.e., what's the average Y going to be, given we know X is this particular value). It's probably fine to think of it as 95% of the regression lines though, because the regression line passes through your estimate of the marginal mean.
I think we're talking about the same thing here.
@topspin said in Scientific Linear Regression:
Also, shouldn't such intervals for a linear regression be straight lines, too? Why are these hyperbolic?
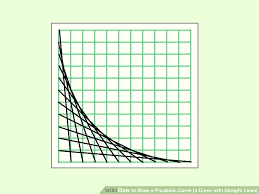
You can think of a linear equation as an intercept and a slope. Now, imagine those two values changing. The lines will slide up and down and the slope will also get steeper and shallower, depending on how you change them. The union of all of those lines will form those curves. Kind of like how these lines make a curve:
-
@topspin said in Scientific Linear Regression:
Shouldn't the confidence interval depend on the actual data?
It does, because the parameters of the line (slope and intercept) are chosen so as to minimize prediction error in this sample. The residual error then feeds into the confidence interval estimate.
Maybe the confidence is better where the density (in x) is higher, even though the regression is bollocks anyway?
Pretty much exactly this, see here: https://en.wikipedia.org/wiki/Leverage_(statistics). Basically, the extreme X values exert a lot of pressure on the slope of the regression line, forcing it to pass near them, worsening your ability to predict where the "real" mean of Y is. Your prediction here is still unbiased, but it's also much more uncertain.
@boomzilla's explanation about the slope and intercept trading off is also right. Points near the middle are going to be fit well, no matter how much the slope and intercept "wiggle" about from sample to sample. But points near the extremes don't fare so well.
-
Agree with @HannibalRex . This is only a WTF if they don't say that this is a null result. Drawing a figure for a null result is unusual I guess, but sometimes helps make it clear. The p- and r- values are certainly saying "nothing here".
Can't be bothered digging up the actual article to check though. :P
-
@BernieTheBernie To my mind, the interesting thing here (assuming, as others have noted, that they're not trying to claim any relationships) is that the second graph in particular really looks like you could draw a better-fitting near-vertical line. (Which a standard regression of y on x won't attempt, because the outlying x values will get massive error terms; it'd be interesting to see if they tried to do a regression of x on y, or a regression that uses distance from line rather than error in x or error in y.) Maybe they need to revisit their assumptions. Although I suppose either way the proper conclusion is likely to be "these things are not related; one is simply more variable than the other."
Couldn't see any details because the article's paywalled, and the figures shown in the abstract weren't as silly as these.
-
Random hopping through XKCD and came across one which fits nicely here:
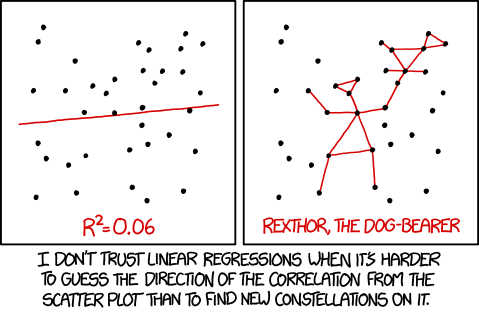
(title text: "The 95% confidence interval suggests Rexthor's dog could also be a cat, or possibly a teapot.")
-
@Scarlet_Manuka said in Scientific Linear Regression:
To my mind, the interesting thing here (assuming, as others have noted, that they're not trying to claim any relationships) is that the second graph in particular really looks like you could draw a better-fitting near-vertical line. (Which a standard regression of y on x won't attempt, because the outlying x values will get massive error terms; it'd be interesting to see if they tried to do a regression of x on y, or a regression that uses distance from line rather than error in x or error in y.
Because that would be backwards of what they were doing, which was using X to predict Y. You're talking about using Y to predict X. Neither one looks meaningful.
-
@boomzilla said in Scientific Linear Regression:
Neither one looks meaningful.
In scholarly terms, “the confidence that a hypothesis other than the null hypothesis is responsible for the correlation in this data is negligible.”
They should run it though Machine Learning. It would still be bullshit afterwards, but they'd have it be blessed by the ghost in the machine.
-
@BernieTheBernie said in Scientific Linear Regression:
That's a very interesting way of establishing a linear regression, isn't it?
They've probably computed the best linear regression, nothing wrong there.
They just forgot that
best != good.

