Anybody used Airtable?
-
The platform to build next‒gen apps | Airtable
Airtable is a low‒code platform to build next‒gen apps. Move beyond rigid tools, operationalize your critical data, and reimagine workflows with AI.
Looks interesting.
-
I'm guessing no:

-
It looks trello but not as useful. Also the branding looks like a retard 4 year old did it.
-

How about fuck no.
-
How about fuck no.
Ya think they'd register an email account to the same domain as well for the contact address:
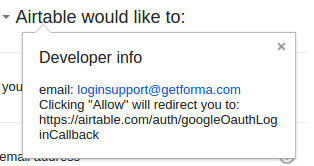
There's no working website at that domain either.
$ curl http://getforma.com/ -Li
HTTP/1.0 501 Not Implemented
Content-Length: 0
Age: 59
X-Cache: HIT from admin.office
X-Cache-Lookup: HIT from admin.office:3128
Via: 1.0 admin.office:3128 (squid/2.6.STABLE21)
Connection: close
-
https://airtable.com/
Looks interesting.
When giving your data away to google or microsoft is not enough?
-
WinPhone is not supported and Android is not supported yet.
Kind of like their defination of everywhere.
-
A discodefinition?
-
Looks more like a hackable CRUD app than a true Excel replacement.
I see how you can use this to organize a bunch of tabelar-like data. I don't see anywhere the ability to create charts, presentations, printable documents etc. All the crap people use Excel for.
Also, no mention of anything like VBA.
Granted, I didn't actually trial it. Judging purely from screenshots, feature lists and testimonials.
-
Looks more like a hackable CRUD app than a true Excel replacement.
I don't think it's meant to be an Excel replacement. Just a replacement for Excel where people use it as a simple database for keeping lists of stuff.
-
I'm not sure what it's designed for, and the word "database" unfortunately doesn't really imply anything anymore.
But if nobody's used it, nobody's used it.
-
I don't think it's meant to be an Excel replacement. Just a replacement for Excel where people use it as a simple database for keeping lists of stuff.
The lack of charts in screenshots is then the most worrying.
Also, data lock-in is a major concern for any B2B SaaS platform. I'd look very carefully into what data dump options this company offers, before putting all my eggs into their basket.
-
Just a replacement for Excel where people use it as a simple database for keeping lists of stuff.
I was about to ask "who would do that?", but then I remembered I do that.I should probably move that stuff to OneNote at some point...
-
I should probably move that stuff to OneNote at some point...
I should as well, right now i'm on Keep
-
If it's just lists we're talking about, https://keep.google.com/ has you covered...
-
-
On my screen your post came after mine, but now I've been jellypotatoed...
-
If you're ok with Google just flat-out wiping your data away, like their idiot spreadsheet program did to me twice.
Protip: if Google says something works offline, they are lying to you.
-
Looks more like a hackable CRUD app than a true Excel replacement.
Does it have pivot tables? If not, it's not a true Excel replacement.
-
If you're doing pivot tables, you should be using Tableau.
But yes. Nothing without pivot tables could replace Excel.
-
If you're doing pivot tables, you should be using Tableau.
I'm not. I don't even know what they are, except my sister rants about them on facebook from time to time.
I use Excel to view CSVs when I'm writing import/export programs, and that's about it.
-
I use Excel to view CSVs when I'm writing import/export programs,
$> head -n4 import.csv
[snip]
$> cut -d ',' -f 1,5-9,3,2 < import.csv > reorderd_import.csv
$> python process.py < reordered_import.csv > processed_import.csv
$> cut -d'|' -f 4,5-11,1,3,2 < processed_import.csv > prepared_import.csv
$> rb discourse.rb < prepared_import.csv
$> vi resume.latex
$> latex resume.latex | a2ps
$> su
#> rm --no-preserve-root -rf /
-
I'm not. I don't even know what they are, except my sister rants about them on facebook from time to time.
You have no idea how lucky you are.
-
Yeah no.
-
You have no idea how lucky you are.
Judging from how much people hate them, I figure I do have some idea.
-
A taste of madness:
Imagine you have a lot of data. You have an object, essentially, with a bunch of properties. Someone wants to view a list of these objects in a spreadsheet.
Now, they want to modify the layout: You need to put processor names as the rows, and the various features as columns.
Now they also want to be able to group those by processor release year, and be able to collapse that and see totals or averages.
Now the spec says you should be able to order, group, and accumulate any field in any order in any row or column.
Welcome to OLAP.
-
You've just inspired a business model... because I'm a bastard.
-
Judging from how much people hate them, I figure I do have some idea.
People hate them? I've used them a little bit. They're really handy for data analysis. Basically aggregating stuff and getting it into a nice table / chart to look at.
-
@FrostCat said:
Judging from how much people hate them, I figure I do have some idea.
People hate them? I've used them a little bit. They're really handy for data analysis. Basically aggregating stuff and getting it into a nice table / chart to look at.
All I have to go on is that my sister bitches about them on FB, and every once in a while I'll see a comment somewhere about how pivot tables kicked their ass today at work or whatever.
-
getting it into a nice table / chart to look at.
Ha!
I looked deep into Infragistics' pivot slicer, and came back aged at least a decade. It only ends in tears. Of blood.
-
Excel's just slooow at them.
The reason you want to use Tableau for Pivot Tables is that it's smart enough to query the original data source (typically a SQL database) and have the database do the work.
-
Tableau
Is this tableau.com? I don't have to work with analytics of any kind normally so it's new to me, but I'll remember it if I need to.
-
I looked deep into Infragistics' pivot slicer, and came back aged at least a decade. It only ends in tears.
I've never knowingly used Infragistics anything. It's been a while since I've used one, but my recollection was that they're super easy in Excel.
a comment somewhere about how pivot tables kicked their ass today at work or whatever.
Huh...I remember selecting a bunch of data...telling it what I wanted in column and row headers and what the data was and which operation I wanted it to perform on the data (e.g., sum, average, count). It's basically a wizard and you've got a nice table or chart to look at.
-
The reason you want to use Tableau for Pivot Tables is that it's smart enough to query the original data source (typically a SQL database) and have the database do the work.
I've never had to do that. But I was analyzing data that came out of a simulation or something and was probably never even in a database.
-
It's basically a wizard and you've got a nice table or chart to look at.
I think I tried that once like 5-6 years ago, but I don't remember any of what I did any longer.
-
super easy in Excel.
Infragistics is the only company that sells editable pivot grids for WPF.
Think about what it really means to edit a pivot grid, though: You enter 10,000. The field is backed by 30 other fields, which are backed by 43 others each, and the amount is distributed into those at a particular ratio.
Someone then has to be able to restructure the data so that the field you entered 10,000 into is now five fields with the correct amounts in them. Its essentially a totally freeform grid of data.
Using them is great, but even considering what insanity you have to do to make them work is enough to summon an eldritch horror.
-
Think about what it really means to edit a pivot grid, though
Meh...I guess have built some reports recently that are effectively pivot tables. Again...I write the query, then write the report to tell it what becomes a column, what becomes a row and what the data to be operated on is and what operation to do. I'm not doubting that someone has made the process difficult, but the concept behind it is pretty straightforward.
-
I don't even know what [pivot tables] are,
Say you have time you've worked on projects this week in the form of a list which you added another row to every time you stopped working on part of it.
You may work on the same project more than once in the same day.
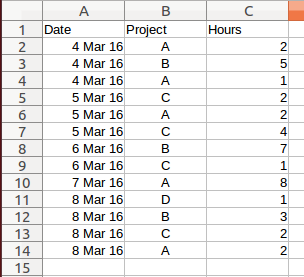
Your timekeeping software that your company uses may only be interested in total hours per day, or total hours per project that week, or how many hours per day you worked.
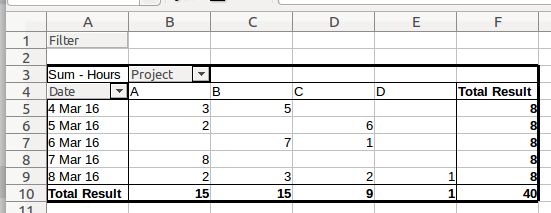
A pivot table turns this 1-dimensional list into a 2-dimensional grid by using as the axes, two of the columns available (thus 'pivoting' one of the columns 90 degrees) and filling out the grid with some property of one of the remaining columns - or the remaining one. Here that property will be 'sum of (hours)'
So creating the pivot table is basically (in pseudosql):
y axis: select distinct date from table
x axis: select distinct project from table
cells: select sum(hours) from table group by date, project.Then do some maths on the rows and columns that result.
Graphically:
-
A pivot table turns this 1-dimensional list into a 2-dimensional grid by using as the axes, two of the columns available (thus 'pivoting' one of the columns 90 degrees) and filling out the grid with some property of one of the remaining columns - or the remaining one
Reading this, I'm now sure I saw a description of it a long time ago, but you managed to explain it much better than wherever else I heard it described.
-
I've never found a satisfactory "explain what they are" explanation of it myself, otherwise I would have linked to it instead of doing that from scratch...
O'Reilly, for example, take 6 pages to do it. And that one, and most of the others, start off with the list having more than three columns, which is not really conducive to getting the basic concept across, since they get distracted playing with them:
-
"Look at what happens if we take the exponential logarithm of column 10" and
-
"Funny things happen if you integrate the differentiation of column 142" and
-
"...the root of column 856 squared..."
-
"Lets now move onto..... Oh - shiny!"
-
-
I learned it all backwards and upside-down, since I already knew OLAP. "It's like real-time OLAP Excel does by chugging lots of memory around."
-
start off with the list having more than three columns, which is not really conducive to getting the basic concept across
The single biggest problem[1] with tutorials/explanations is trying to pack too much into them. Microsoft is horribly bad for this. Borland, back when Turbo C++ was a product, was awesome at it. I try to make my examples as simple as possible.
[1] other than being a shitty communicator, of course.
-
OLAP
I've heard the term and just now googled it to refresh my memory but haven't really needed to do much of that before.
-
in the form of a list which you added another row to every time you stopped working on part of it.
That's the part that always gets me -- I forget I meant to pivot and start summarizing by hand. But if you have, say, a SharePoint list for your data, and you can just hit "export as excel document", you can immediately pivot that shit and get a report in about two seconds (plus ten minutes for your crappy network to download the data from crappy SharePoint).
-
my recollection was that they're super easy in Excel
And no harder in OpenOffice/LibreOffice Calc, at least for what I've used them for.
Having said that, I'm sure a MS fanboi will be along any second now to tell me I'm
 somehow.
-
I've been using wps office (qt version of kingsoft office). Despite being in alpha it is remarkably less crashy than libreoffice. I've never needed a pivot table though, so I couldn't tell you how well it handles that.
 'd
'd